
Reading Time: 14 minutes
The Real Price of Data Blindness
Here’s a scenario that plays out in boardrooms more often than anyone admits: The marketing team reports that Google Ads drove 400 funded accounts last quarter at a $375 cost per acquisition. The finance team, looking at actual account openings, counts 650 funded accounts. Where did those extra 250 accounts come from?
Nobody knows. And that uncertainty isn’t just an annoying mystery—it’s costing real money.
When 40% of your conversions can’t be attributed to a specific channel, you’re making budget decisions with fundamentally flawed information. You might be scaling campaigns that aren’t actually performing, while cutting channels that are driving results you simply can’t see. For options and futures firms where customer acquisition costs run $300-800 and lifetime values reach into the thousands, these blind spots translate directly into wasted ad spend and missed growth opportunities.
The financial impact isn’t theoretical. It shows up in inflated cost-per-acquisition numbers, misallocated budgets, underperforming campaigns that should be cut, high-performing campaigns that get starved of budget, and CFOs increasingly skeptical of marketing’s reported ROI.
How Bad Data Compounds Into Bad Decisions
Bad data doesn’t just give you wrong answers—it teaches advertising algorithms the wrong lessons, creating a feedback loop that degrades performance over time.
Modern digital advertising depends heavily on machine learning. Google’s Smart Bidding, Meta’s Advantage+ campaigns, and similar tools use conversion data to understand which users are likely to become customers. When you’re only feeding these systems half the conversion data, they’re optimizing toward an incomplete picture.
Consider what happens when a significant portion of your iOS users—who are often your highest-value prospects—aren’t being tracked due to App Tracking Transparency. The algorithm never learns that these users convert. It starts to deprioritize them, shifting impressions toward lower-value audiences where tracking still works. Your cost per acquisition rises. Your campaign performance degrades. And you may never realize why.
This isn’t speculation. We’ve seen trading platforms where fixing the data foundation led to 25-35% improvements in ROAS within 60 days—simply because the algorithms finally had accurate signals to optimize against.
Calculating Your True Data Gap Cost
Let’s put concrete numbers on this problem. If you don’t know how much bad data is costing you, you can’t make an informed decision about fixing it.
The Data Gap Formula:
Start with your monthly ad spend, then calculate your expected conversions based on actual funded accounts from all sources. Compare this to conversions reported in your ad platforms. The difference is your attribution gap.
Example Calculation for a Mid-Size Futures Platform:
Consider a firm with monthly ad spend of $75,000, actual funded accounts of 200, and platform-reported conversions of 125 (combined across Google, Meta, and other channels). The attribution gap is 75 conversions, representing 37.5% of actual results that can’t be attributed.
If 37.5% of conversions are invisible, the algorithms controlling your ad spend are optimizing against 62.5% of reality. That means roughly 37.5% of your optimization is based on incomplete data, which translates to approximately $28,000 per month in potentially misallocated spend, or $336,000 annually.
Even if you assume only half of that misallocation represents actual waste (the rest might accidentally work out), you’re still looking at $168,000 per year in preventable inefficiency.
The Four Ways Bad Data Drains Your Budget
1. Budget Misallocation Across Channels
Without accurate attribution, you can’t see which channels actually drive funded accounts versus which channels get credit they don’t deserve. The classic example: Google search often gets outsized attribution credit because it’s frequently the last click before conversion. But did Google actually drive that customer, or did they see your content on LinkedIn, research you organically, and then search your brand name on Google?
If you’re over-investing in branded search while under-investing in the awareness channels that actually created demand, you’re essentially paying for conversions that would have happened anyway.
2. Creative and Audience Testing Paralysis
Effective paid media requires constant testing—new creative, new audiences, new messaging. But testing requires data. When 40% of your conversions aren’t being tracked, your test results are unreliable. A campaign that appears to have a $600 CPA might actually have a $400 CPA if you could see all the conversions.
This uncertainty makes it nearly impossible to make confident decisions about what’s working. Marketing teams either become paralyzed (afraid to make changes) or reckless (making changes based on noise rather than signal).
3. Algorithm Training Degradation
We touched on this earlier, but it bears emphasizing: modern ad platforms are optimization machines. They work incredibly well when they have good data. They work terribly when they don’t.
Every conversion you don’t track is a missed training signal. Every user who converts but isn’t tracked teaches the algorithm that users like them don’t convert. Over time, this compounds into systematically poor targeting.
4. Incorrect Lifetime Value Calculations
Customer lifetime value (LTV) calculations depend on being able to connect marketing source to long-term account behavior. When you can’t track which marketing channel brought in a customer, you can’t calculate channel-specific LTV.
This matters enormously for data-driven businesses where customer quality varies wildly. A trader who funds with $5,000 and trades actively for years is worth far more than one who funds with $1,000 and churns in three months. If you can’t tie these behaviors back to acquisition source, you’re flying blind on the metrics that matter most.
Case Study: The $2.4 Million Attribution Mistake
A mid-size equity options client came to us with a puzzle. Their marketing team was reporting $2.1 million in annual ad spend generating approximately 4,200 funded accounts—a $500 CPA that the CFO found acceptable given their LTV calculations.
But finance had a different number. They counted 5,800 funded accounts that year. Nearly 1,600 accounts—28% of total—had no marketing attribution whatsoever.
The marketing team had been making budget decisions assuming their paid channels were driving 4,200 accounts. In reality, something was driving an additional 1,600 accounts that nobody could see. Was it organic search? Content marketing? Word of mouth? They had no idea.
The Investigation
We implemented comprehensive tracking audits across their entire marketing stack. What we found was a perfect storm of data loss:
- iOS users represented 45% of their traffic, but only 23% were being tracked due to ATT opt-outs
- Ad blockers affected approximately 30% of their technically sophisticated trader audience
- Their cookie consent implementation was blocking analytics for an additional 15% of users
- Multiple tracking scripts were conflicting with each other, causing intermittent failures
When we modeled the compound effect of these factors, we estimated they were capturing only about 55-60% of actual conversion events.
The Fix
The solution involved implementing Google Tag Manager Server-Side as their tracking foundation, deploying Meta Conversions API for Facebook/Instagram campaigns, setting up enhanced conversions for Google Ads, creating a first-party data infrastructure that connected website behavior to CRM data, and building reconciliation dashboards that compared platform data to actual funded account counts.
The Results
Within 90 days, their platform-reported conversions increased by 38%—not because they were getting more conversions, but because they were finally tracking the conversions that were always happening. More importantly, they could now see which channels were actually driving their best customers.
The revelation: their YouTube campaigns, which had appeared to have a $700+ CPA and were scheduled for budget cuts, actually had a $380 CPA when properly tracked. They had been about to eliminate one of their most efficient channels. Their branded search campaigns, meanwhile, were getting credit for conversions that actually originated elsewhere.
With accurate data, they reallocated $400K in annual spend. Conservative estimates put the efficiency gains at $800K in the first year—equivalent to driving the same results with significantly less spend, or driving significantly more results with the same spend.
Building a Data Quality Foundation
Fixing your data isn’t a one-time project—it’s building infrastructure that will support better decisions indefinitely. Here’s the framework we use with trading platforms:
Layer 1: Server-Side Tracking Foundation
The most important single investment you can make is moving from client-side to server-side tracking. This means deploying Google Tag Manager Server-Side (typically on Google Cloud), configuring server-side connections to all major ad platforms, setting up first-party cookie management for improved user identification, and implementing consent mode that respects user choices while maximizing data where consent is given.
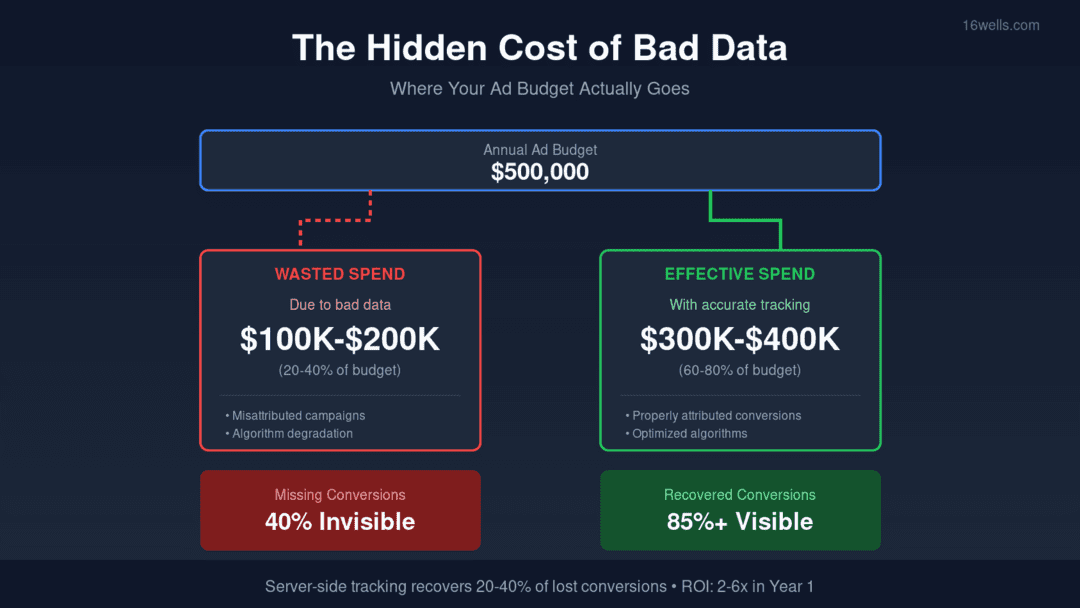
This single change typically recovers 20-35% of “lost” conversions.
Layer 2: Platform API Integrations
Beyond basic tracking, implement native API connections. Meta Conversions API sends conversion data directly from your servers to Meta, bypassing browser limitations entirely. Google’s Enhanced Conversions allows you to pass hashed customer information that helps Google match conversions across devices and sessions. Similar APIs exist for LinkedIn, TikTok, and other platforms.
Layer 3: Backend Data Enrichment
The real power of server-side tracking is the ability to enrich marketing data with backend information. When a user opens a funded account, you can pass not just “conversion happened” but the funded amount, the products they’re interested in, and their predicted LTV based on similar customers.
This creates much more valuable optimization signals than simple binary conversion tracking.
Layer 4: Reconciliation and Validation
Build dashboards that continuously compare platform-reported conversions against actual business results (funded accounts, AUM growth, trading activity). When discrepancies arise, you catch them quickly rather than discovering months later that your data has been degraded.
ROI of Fixing Your Data Infrastructure
Let’s model the return on investing in data quality:
Investment costs include:
- Implementation work (typically 80-120 hours of technical work, valued at $12,000-$25,000)
- Infrastructure costs ($300-800/month for server-side hosting)
- Ongoing maintenance ($500-1,000/month for monitoring and optimization)
First-year total investment: $20,000-$45,000
Returns come from:
- Recovered conversion visibility (20-35% more conversions tracked, enabling better optimization)
- Algorithm performance improvement (10-25% improvement in ROAS over 6-12 months)
- Budget reallocation savings (5-15% of ad spend redirected from underperforming to performing channels)
- Avoided waste (campaigns that would have been cut or scaled incorrectly)
For a platform spending $500K annually on paid media:
A conservative 15% improvement in overall efficiency equals $75,000 in value. Moderate estimates of 25% improvement equal $125,000 in value. The ROI multiple ranges from 2-6x in the first year alone, with compounding benefits in subsequent years.
Frequently Asked Questions
How do I know if my marketing data is inaccurate?
Compare your platform-reported conversions (in Google Ads, Meta Ads Manager, etc.) against your actual business results (funded accounts, sales, etc.) over a 90-day period. If there’s more than a 10-15% gap, you likely have significant data quality issues. Also check if your traffic and conversion numbers dropped significantly in 2021-2022 when iOS 14.5 rolled out—that’s often a sign of persistent tracking gaps that were never addressed.
What’s the difference between attribution problems and tracking problems?
Tracking problems mean conversions aren’t being recorded at all—the data doesn’t exist. Attribution problems mean conversions are being recorded but assigned to the wrong source. Both cost you money, but tracking problems are more severe because they also degrade algorithm performance. Server-side tracking primarily fixes tracking problems; multi-touch attribution models address attribution problems.
How long does it take to see results from fixing data infrastructure?
You’ll see immediate improvements in conversion visibility (within days of implementation). Algorithm performance improvements typically become visible within 30-60 days as platforms relearn with better data. Full optimization benefits usually realize within 90-180 days. The timeline depends partly on your ad spend volume—higher-volume accounts generate data faster.
Should I fix data quality before or after scaling ad spend?
Before. Scaling ad spend on top of broken data just scales your inefficiency. It’s like pressing harder on the gas pedal while your wheels are misaligned—you’ll go faster, but not in the right direction. Fix the foundation first, then scale with confidence that your optimization is working correctly.
How does server-side tracking affect page load speed?
Server-side tracking typically improves page load speed because you’re removing multiple heavy JavaScript tags from the client-side. Instead of the user’s browser running scripts for Google Analytics, Meta, Google Ads, LinkedIn, and others, a single lightweight script sends data to your server, which then distributes it. Most implementations see 10-20% improvements in page load metrics.
What if I’m using a third-party trading platform (white-label)?
If you’re on a white-label platform, you may have limited control over tracking implementation. Work with your platform provider to understand what server-side tracking options they support. Many modern white-label solutions now offer GTM Server-Side integration or API-based conversion tracking. If yours doesn’t, this should be a factor in platform evaluation.
Key Takeaways
Bad data isn’t just an inconvenience—it’s an active drain on your marketing budget. For financial firms where margins matter and every acquisition dollar needs to work hard, operating with 40% data blindness is simply unacceptable.
The fix isn’t complicated or particularly expensive relative to the waste it prevents. Server-side tracking, API integrations, and proper data infrastructure are mature, proven technologies. The firms that have implemented them are operating with a significant competitive advantage: they know what’s actually working, they can optimize with confidence, and they’re not leaving money on the table.
The question isn’t whether you can afford to fix your data infrastructure. It’s whether you can afford not to.